

Market Signals
Understanding Investment Signals
In the current economic climate, discerning investment strategies can be particularly challenging, yet the abundance of data at investors’ fingertips has never been greater. For active investors, understanding certain risk signals can vastly improve the quality of short to intermediate-term investment decisions. Here, we'll decode three such signals, offering strategic insights to leverage them effectively.
Investment signals must be selected based on personal comfort with risk and investment style. Not all signals carry the same weight; some are suited for a percentage of the portfolio, while others might be implemented across the entire portfolio. Key factors influencing this decision include personal risk profiles, investment time horizon, and a preference for active versus passive strategies. The diversity in strategy adoption reflects the spectrum of investor profiles and goals.
Applying Market Signals
Sophisticated investors often use a variety of technical trading signals to guide their investment decisions. The short-term signals reflect immediate market sentiments and are apt for investors engaged in frequent trading. Conversely, long-term signals like the S&P 500 200-day moving average cater to investors aiming for gradual portfolio adjustments over extended periods. Here are some of the most common signals and a simple way for beginner traders to understand and potentially use them:

Moving Averages (MAs):
Description: Averages that smooth out price data to form a single flowing line, making it easier to identify the direction of the trend. A chart showing a stock price along with its 50-day and 200-day moving averages. The point where the stock price crosses above the MA line could be considered a buy signal, and conversely, crossing below as a sell signal.
Action: Look for the price crossing over a moving average line – it often indicates a potential trend change. The 50-day and 200-day MAs are popular choices.
Moving Average Convergence Divergence (MACD):
Description: A trend-following momentum indicator that shows the relationship between two moving averages of a security’s price. A graph where the MACD line (difference between the 12-day and 26-day exponential moving averages) and the signal line (9-day EMA of the MACD) are plotted. A buy signal is indicated when the MACD crosses above the signal line, and a sell signal when it crosses below.
Action: When the MACD crosses above its signal line, it could be a buy signal, and when it crosses below, a potential sell signal.
Relative Strength Index (RSI):
Description: An oscillator graph with a range from 0 to 100. An asset is considered overbought and a potential sell when the RSI exceeds 70, and conversely, oversold and a potential buy when it drops below 30.
Action: An RSI reading above 70 suggests an asset may be overbought, while a reading below 30 indicates it could be oversold.
Bollinger Bands:
Description: A set of trendlines plotted two standard deviations away from a simple moving average.
Action: Prices are considered high when touching the upper band and low when they touch the lower band.
Fibonacci Retracements:
Description: A technical indicator based on the idea that markets will retrace a predictable portion of a move, after which they will continue to move in the original direction. Fibonacci retracement levels—stemming from the Fibonacci sequence—are horizontal lines that indicate where support and resistance are likely to occur. Each level is associated with a percentage. The percentage is how much of a prior move the price has retraced. The Fibonacci retracement levels are 23.6%, 38.2%, 61.8%, and 78.6%. While not officially a Fibonacci ratio, 50% is also used. The indicator is useful because it can be drawn between any two significant price points, such as a high and a low. The indicator will then create the levels between those two points.
Action: Use these levels as potential support and resistance; they may indicate where to buy or sell.
Candlestick Patterns:
Description: A style of financial chart used to describe price movements. Certain formations can signal entry or exit points. Candlestick patterns are technical trading tools that have been used for centuries to predict price direction. Candlestick patterns, a cornerstone of financial charting, distill price movements into formations that help pinpoint trading opportunities, from entry to exit points. These patterns, rich in history and variety, like the contrasting "abandoned baby top" and "bottom" or "tweezer tops" and "bottoms," serve as a guide for traders to forecast price direction, often complemented by other technical indicators to enhance trading strategies.
Action: Look for patterns like ‘bullish engulfing’ or ‘bearish harami’ as possible indicators for trend reversals.
Volume:
Description: The amount of an asset that changes hands over a set period. A volume bar chart underneath the price chart showing the amount of trading activity over a certain period. Increasing volume confirms the strength of a trend, while decreasing volume may signal its weakness.
Action: Increasing volume on a price trend confirms the strength of that trend; decreasing volume may signal it’s weakening.
Support and Resistance Levels:
Description: A price chart with horizontal lines drawn at points where the price has historically struggled to move above (resistance) or below (support). Price levels on a chart where the probabilities favor a pause or reversal of a prevailing trend. These levels are used to identify potential entry or exit points.
Action: Consider buying near support levels and selling near resistance levels or when a breakout occurs.
For newer investors, it's essential to remember that no technical analysis indicator is infallible. It’s often recommended to use these signals in combination with one another for confirmation. For instance, a buy signal from MACD is stronger if it coincides with an RSI that indicates the asset is oversold.
3 Investment Signals for Active Traders:
Incorporating these sophisticated insights into your investment strategy not only enhances your understanding of market dynamics but also equips you with actionable steps to navigate the complex financial landscape with greater foresight.

(1) Utilities vs. S&P 500 Ratio:
Indicator: Utility sector's outperformance can signal market apprehension about economic downturns. Utilities may become a haven in low yield environments, offering higher yields. This ratio offers a nuanced view of market sentiment, particularly regarding risk tolerance among investors. When utility stocks, often considered stable and less volatile, outperform the broader market represented by the S&P 500, it can signal a flight to safety among investors, possibly due to concerns about market instability or economic downturns. This shift often results in higher relative yields from utilities, making them attractive in uncertain times.
Action: Monitor the Utilities vs. S&P 500 ratio closely, especially during periods of market volatility. A rising trend might be an early indicator to reallocate assets towards the Utilities Select Sector SPDR ETF (XLU) as a defensive posture against market downturns. Conversely, a declining trend, where the broader market begins to outperform, signals a return of investor confidence, making it an opportune time to shift towards more aggressive growth strategies, such as investing in the S&P 500 ETF (SPY).

(2) Long vs. Intermediate Treasuries Ratio:
Indicator: Long-term Treasuries outperforming intermediate indicates a cautious shift to safer assets. The performance comparison between long-term and intermediate-term Treasuries serves as a barometer for investor sentiment towards future economic conditions. A preference for long-term over intermediate Treasuries suggests a hedging strategy against long-term economic uncertainties, where investors seek the safety of guaranteed yields over extended periods.
Action: Use this ratio as a strategic lever for adjusting portfolio risk. In periods where long-term Treasuries gain favor, consider moving assets into the iShares 20+ Year Treasury Bond ETF (TLT) to safeguard your portfolio against anticipated volatility or downturns. As optimism returns and intermediate Treasuries start to perform better relative to their long-term counterparts, reallocating to broader market instruments like the SPY can enhance portfolio growth potential.
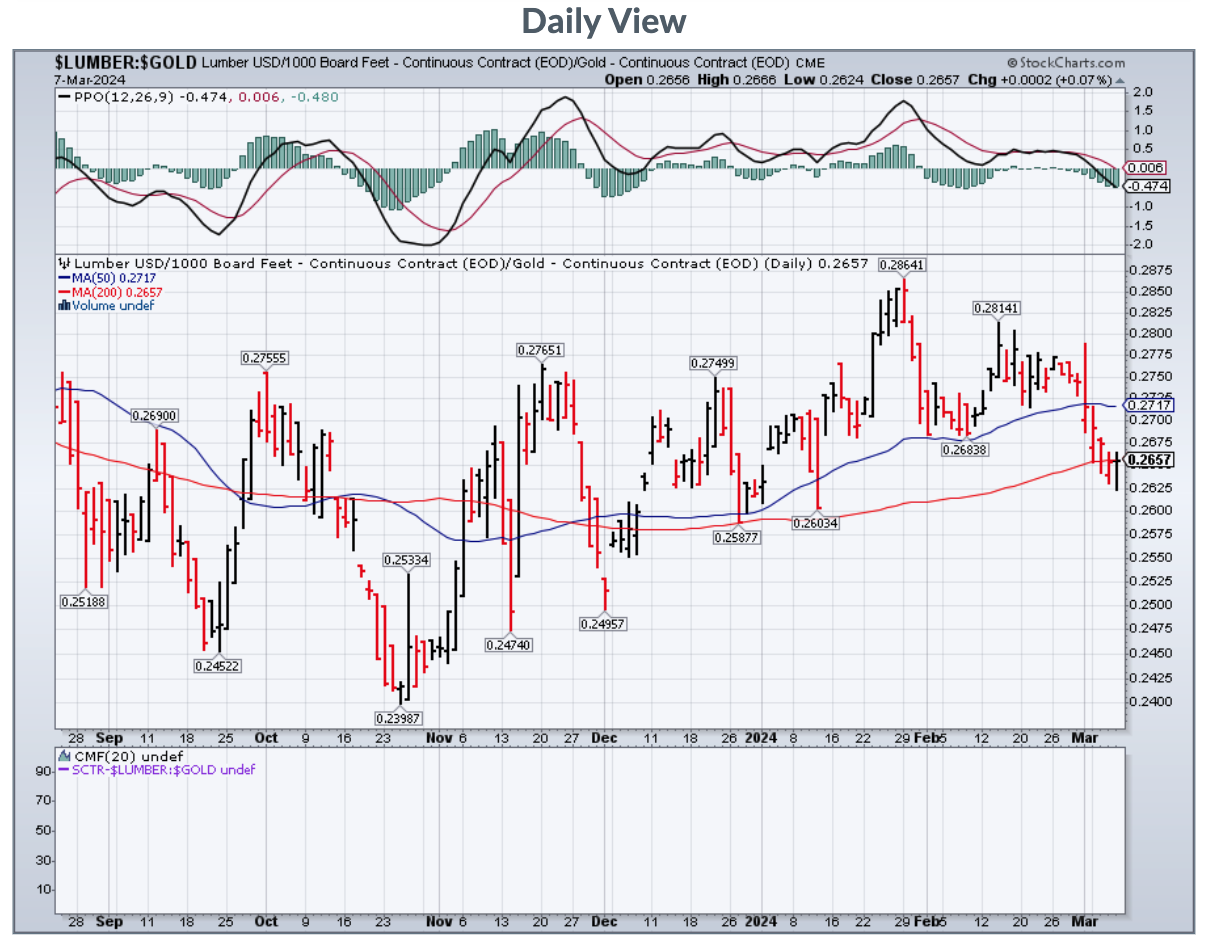
(3) Lumber vs. Gold Ratio:
Indicator: Rising lumber prices often correlate with economic growth and real estate development; increasing gold prices may denote a move towards safer assets during uncertain times. This unique ratio juxtaposes the performance of two seemingly unrelated commodities: lumber, driven by economic activity and construction demand, and gold, a traditional safe-haven asset. An increasing lumber-to-gold price ratio indicates economic optimism and growth, as demand for construction materials rises. Conversely, a rising gold price relative to lumber suggests increasing caution among investors, who may be moving assets into gold to protect against perceived risks.
Action: Analyze the lumber vs. gold price dynamics as a complementary indicator to broader economic analyses. In times of economic expansion and confidence, positioning in Lumber ETFs may leverage growth in construction and real estate. However, in periods marked by uncertainty or inflation concerns, reallocating investments towards Gold ETFs can provide a protective hedge against market volatility and preserve capital.
Resources for Implementation:
An informed approach to investment signals can empower investors to navigate market fluctuations adeptly. By integrating these signals into their strategy, investors can anticipate market trends and adjust their portfolio to align with the current economic narrative. Remember, while data is plentiful, wise investments are made by interpreting signals through the lens of an informed strategy, balanced by individual risk tolerance and market conditions.
Newer investors should also consider:
Start with a demo account to practice trading without risking real money.
Keep it simple by starting with just one or two indicators until they're well understood.
Develop a trading plan and stick to it, using technical indicators to inform but not solely dictate decisions.
Understand the risks and use risk management strategies such as stop-loss orders.
Learn continuously by reading books, taking online courses, or following reputable financial educators.
While Investors should use analytical tools like Bloomberg Terminal or Reuters Eikon for real-time market data and trends analysis. Websites such as Investopedia provide educational resources on market indicators and how to interpret them.
For ETF trading, platforms like Vanguard or Fidelity offer a diverse range of investment options with detailed fund performance analysis.